Data Mystery!
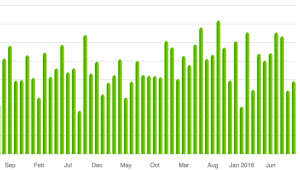
I like to track our family’s earning/spending habits, and it has come in handy a number of times. But every once in a while fun patterns emerge. So I present to you now one such data mystery. This is a plot of our spending on <something> each month. The values have been removed, because mystery. Anything jump out at you?
To me, there are two months that appear as outliers: January 2016 and September 2013 have noticeably less spending than other months. Perhaps we’d like to know why.
What if I told you this was a plot of how much we spend on food each month (groceries, restaurants, etc.)? Could you guess why there would be two months with so little spending? It’s not as if we can just decide not to eat…
You might guess those were months we ate out less, since dining out is often more expensive than buying groceries, and you’d be partially correct. But those values are low enough that we spent awfully little on groceries too.
Turns out that those were the two months immediately following the births of our two kids. So we definitely were not eating out at restaurants very much. And both times we had prepared in advance by stocking our freezer, so we had less need for big grocery shopping trips.
But there’s a second pattern here. Each of those two low-spending months was followed by a very high-spending month. Can babies explain that too? Of course they can’t, because babies can’t talk. But they are part of the explanation. We like to travel, and during the final few months of pregnancy it is hard to do so. So when our kids were old enough (6 weeks or so) we took big trips and dined out quite a lot, leading to two of our highest-spending months in the series.

